Friday, October 29, 2010

Localisation, Participation and Communication PGIS

This great video was posted by Giacomo Rambaldi on the PPGIS blog.

Here is the description from the blog:

The 25-min educational video documentary (see link below) introduces the practice of participatory spatial information management and communication (PGIS) in the development context. It has been designed to introduce development practitioners (technology intermediaries) to the practice of demand-driven PGIS.

In this video, PGIS practice is presented as a continuum starting from community mobilisation to project planning and design, choice of mapping methods and technologies, visualisation of different technologies in diverse ethno-cultural and agro-ecological environments, and finally putting the maps to work in the domains of identity building, self-determination, spatial planning and advocacy.

Ethics and sound attitudes and behaviours are emphasized as cross-cutting imperatives.


Localisation, Participation and Communication: an Introduction to Good PGIS Practice from CTA on Vimeo.

Friday, June 25, 2010

Evolving Data Server Solutions

Many are interested in the intersection of geospatial technologies, place, and culture because of the power that maps have for telling stories about the relationships between people and the places they inhabit and transform. That is certainly one reason I´m continually fascinated by this subject. However, if once produced a map simply sits in a dusty filing cabinet than what good is it?

Geographic information systems (GIS) as digital repositories of spatial data (including both quantitative and qualitative data forms, vis. a vis sources such as multimedia and embedded text). With the advent and now ubiquitous place of GIS it has become very easy to transmit maps and cartographic data electronically.

The caveat, until relatively recently, has been how and to whom the data are transmitted. Emailing a map as a .jpg or set of cartographic data as a zipped attachement to a colleague is one thing. Making those data available for public usage is completely different.

High-end (in terms of both financial expenditure and tehnological prowess) spatial data servers have been online for sometime now. These include product by the big names in databases Oracle for example. ESI´s ArcGIS server is another common player. However, these are mostly spatial database solutions for those with big budgets (again in terms of finances and labor-which are maybe the same...).

What options are there for those of us interested in more open-source data serving solutions?

One option that I'd like to highlight is called Data Basin. It is a great site that allows users to "explore and download a vast library of datasets, connect to external data sources, upload and publish your own datasets, connect to experts, create working groups, and produce customized maps that can be easily shared". And best of all....it's free! Within Data Basin, users can search and download datasets, as well as share their own. The website also provides a space for user groups where spatial data can be easily shared. Very cool indeed.

Monday, June 14, 2010

Mapping the Deep Water Horizon


The basic details are well known: on April 20th, an explosion on the drilling rig "Deepwater Horizon" killed eleven crewmen; the fire was could not be extinguished and on April 22nd the rig sank, leaving the well gushing, resulting in the largest off-shore oil spill in United States history.

Since late April, millions across the globe have become increasingly concerned with the impending disaster growing in the Gulf of Mexico. One of the factors behind this growing concern have been the proliferation and extensive usage of remote sensing technologies. From satellite sensors to underwater cameras, concerned citizens, politicians, disaster management responders, and corporate executives have anxiously followed the online images and video feeds.


Aside from pretty (or grainy) pictures and videos, at a broad scale, what do these media forms, and their usages, tell us about interactions between humans and the environment in this contemporary moment. More specifically, how do these technologies, and their usages, inform our understanding of the "production" of environmental disasters, their (re)mediation, and the assignment of blame?

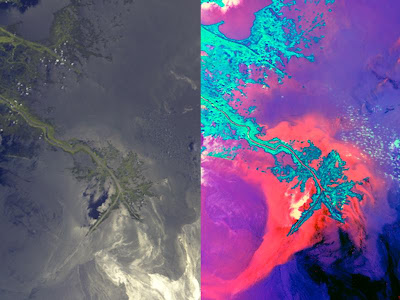
First, what are the media through which we are increasingly coming to remotely know this expanding place that is the disaster area? Due to the spatial and temporal scales of the spill (i.e. how much and how fast it is growing) as well as its distant location (both from land and below sea), remote sensing technologies have been of incredible value and used widely. Remote sensing is frequently thought to pertain solely to satellite images. However, as wiki informs us: remote sensing is "the use of either recording or real-time sensing device(s) that are wireless, or not in physical or intimate contact with the object". With this definition, we see that much of our individual and collective knowledge of this place, and its recent transformations, have occurred as a result of remote sensing technologies: principally satellite images and underwater video feeds.

In trying to keep this post short, I´ll simply direct the interested reader to several sites I think are thought provoking on the topic.

The first link takes you to NASA´s page devoted to the oil spill. Here you´ll find a variety of links to specific sensors, and stories derived from them (think how do we know we have environmental problems...)

The next link takes you once again to NASA, but this time o it´s AVIRIS sensor page (for images obtaned from an airplane vis a vis a sensor)


Following that you might be interested in what some of the other private and commercial satellites are up to in this time of environmental disaster. To help answer that question see the following link for imager from Terra, Digital Globe etc.

After that, on our tour of remote sensing media, I´d suggest a peek at this link to a real-time server illustration showing the growing extent of the damage showing spill.

It's not only the spatial and environmental scale of the disaster that are expanding (clearly the two are linked)as the following link shows, the political extent of spill is increasing...

Perhaps Obama gave Discover Magazine it´s headline illustrated in this last link...

What will be the short and long term implications of this spill at various scales from environmental, economic, political, and cultural perspectives. I don´t have the answers, but what I do think is that remote sensing technologies will play an important role in how we understand the nature of the problem and the potential solutions.

Tuesday, May 25, 2010

Geotagging photos

If a picture is worth a thousand words, as the adage goes, than what is a geotagged photo worth? Priceless. What is a "geotagged photo" you might ask....well, in borrowing shamelessly from wikipedia:

Geotagging is the process of adding geographical identification metadata to various media such as photographs, video, websites, or RSS feeds and is a form of geospatial metadata. These data usually consist of latitude and longitude coordinates, though they can also include altitude, bearing, distance, accuracy data, and place names.

Some cell phones like the iPhone and Samsung Memoir already utilize a GPS chip along with built-in cameras to allow users to automatically geotag photos. A few cameras such as the Ricoh 500SE and the Sony DSC-HX5V have built-on or built-in GPS that allow for automatic geotagging. Nikon and Canon have also come out with custom geotagging solutions. Almost any digital camera can be coupled with a GPS and post processed with photo mapping software such as GPS-Photo Link, MediaMapper, Topofusion or EveryTrail GPS Connector (for Garmin gps products) to geotag photos by matching gps coordinates with photos. Twitter, the popular social networking and microblogging service that enables its users to send and read messages known as tweets, allows its users to geotag their locations via their tweets and pictures.......


So that's geotagging in a nutshell. Now why do I consider it priceless? From the perspective of an anthropologist who strives to integrate cultural data into geographic information systems (GIS), geotagging photos is an incredible way to add texture and nuance to traditionally two-dimensional maps. Photos taken at one's field site are a form of ground truth data, or data that are collected on location (as opposed to data collected remotely, such as aerial photographs and satellite images). Ground truthed data are important as they improve the accuracy of one's analysis (regardless of whether one is a forester, anthropologist, human geographer, or urban planner).

I have become interested in geotagging photos in the context of my dissertation research on landscape change within the Brazilian Landless Workers' Movement (MST). More specifically, I think geotagging photos will have great applicability in my research for helping to tell local people's stories.


I've recently been experimenting with the Ricoh Caplio 500SE camera system (camera + integrated GPS device). To date, I've been moderately impressed with this system. Yes, it does it's job, i.e. georeferencing photos....but it is fairly complicated to figure out how to use it. What has been even more frustrating has been integrating these data into a geographic information system, which from my perspective is the entire point of these cameras. As indicated in the Wiki description, there are various programs (both online and ones that can be downloaded to your computer) that allow one to do approximate geotagging via landmarks (i.e. take a picture of your house, go into Google maps, and link that photo with your house, or get the lat/long from Google Earth and do it more accurately). However, if you want to put your photos into a geographic information system (GIS) for whatever purpose (research, urban planning, ultimate techie street-cred) than it seemed that you would need to cough up more than $300 for the GPS Photolink Pro software package. This seemed ridiculous to me, and so I did a bunch of searching online, and found a solution, which I thought I'd share with y'all: ArcPhoto

In brief, ArcPhoto is a free toolset (a script) that can be used in ArcGIS. Here is what ESRI has to say about it: The ArcPhoto Tools are a set of geoprocessing tools and ArcMap user interface enhancements to enable the quick import of digital photography into the ArcGIS framework. The tools work directly off the EXIF (Exchangeable image file format) header information that is encoded into digital imagery. This information usually includes information about the type of camera used, focal length, aperture, type of flash, etc. For professional grade cameras or images taken with ArcPad 7/8, the imagery can potentially hold GPS location information about where the photo was taken as well. At 9.2 the ArcGIS framework can directly read this type of metadata and with the help of the location information the ArcPhoto tools allow for a quick and streamlined integration of rich visual information.

Special functionality for ArcMap includes the display of thumbnail images as “map tips” and the ability to create ArcPhoto Elements – think of thumbnail images as annotation for point features. Finally within the 3D environment the images are applied to create billboards and they are displayed using the captured orientation of the digital photography.


If you download it, make sure you read through the Read Me file (which should be located here on your computer once you download it C:/Program Files/ESRI/ArcPhoto Tools/Documentation/ArcPhoto.htm).

After some brief experimenting, I found that this program provides the functionality I'm looking for, namely, taking photos (either georeferenced or not-i.e. with knowledge of lat/long points you can geotag them yourself) and integrating them in a GIS, and the ability to create shapefiles from them.

As my research progresses I'll be sure to provide updates on these technologies.